

We’ve all been there: the finish line is crossed, the medals are handed out, and the donation checks are written. But then, the silence falls. Did that walk actually make anyone healthier, or was it just a really fun afternoon in the park? For years, the answer was a frustrating “we don’t know.” We could count the miles, but we couldn’t count the lives changed.
That’s exactly why we built this guide. At Walkathon Benefits™, we’ve seen too many organizers throw away the data that could prove their event’s true worth. Imagine if you could tell your sponsors, “Not only did we raise $50,0, but we also helped 30 participants lower their average resting heart rate by 5 beats per minute.” That’s the power of evidence-based charity.
In this article, we’re ditching the guesswork. We’ll walk you through 7 essential metrics to track, the best wearables to use (and which ones to skip), and how to turn raw data into a compelling story of health transformation. Whether you’re a seasoned event planner or a first-time volunteer, you’ll learn how to measure the real impact of every step taken. Ready to turn your next walkathon into a data-driven health revolution? Let’s dive in.
Key Takeaways
- Holistic Measurement is Non-Negotiable: True impact goes beyond steps; you must track physical, mental, and social health outcomes to prove long-term value.
- Tech is Your Best Friend: Leverage wearables like Fitbit and Garmin, along with apps like Strava and Charity Miles, to gather real-time biometric data.
- The “Adherence” Metric Matters Most: The most critical success indicator isn’t the day-of activity, but the long-term lifestyle change measured 3 to 6 months post-event.
- Data Drives Funding: Sponsors and donors are increasingly demanding quantifiable health ROI; robust measurement secures future support.
- Start Simple: You don’t need a lab to begin; a combination of pre/post surveys and basic GPS tracking can yield powerful insights.
Table of Contents
- ⚡️ Quick Tips and Facts
- 📜 A Brief History: From Charity Miles to Data-Driven Impact
- 🏃 ♂️ Why Measuring Health Outcomes Matters in Charity Walks
- 📊 7 Essential Metrics for Tracking Participant Health Improvements
- 📈 5 Ways to Quantify Physical Activity and Cardiovascular Gains
- 🧠 6 Strategies for Assessing Mental Well-being and Stress Reduction
- 📱 Leveraging Wearables and Apps for Real-Time Health Data
- 📝 4 Types of Surveys to Capture Participant Feedback and Lifestyle Changes
- 🚧 Overcoming Common Obstacles in Health Outcome Measurement
- 🔍 5 Steps to Designing a Robust Pre- and Post-Walk Assessment Plan
- 🏆 The Role of Gamification in Boosting Engagement and Health Tracking
- 🤝 How Corporate Social Responsibility (CSR) Drives Long-Term Wellness
- 🌍 Community Impact: Beyond the Individual Participant
- 💡 Final Thoughts: Turning Steps into Statistics and Stories
- ❓ Frequently Asked Questions About Measuring Health Outcomes in Charity Walks
- 🎯 Conclusion
- 🔗 Recommended Links
- 📚 Reference Links
⚡️ Quick Tips and Facts
Before we dive into the nitty-gritty of data dashboards and heart rate monitors, let’s hit the ground running with some hard-hitting truths about charity walks. You might think a charity walk is just a bunch of people in matching t-shirts shuffling around a park, but the science behind it is as robust as a marathoner’s calves.
- The “Every Mile Matters” Principle: It’s not just a catchy slogan. Research shows that consistent, moderate-intensity walking (like that found in charity walks) can lower the risk of cardiovascular disease by up to 30% American Heart Association.
- Mental Health Boost: A single 30-minute walk can reduce cortisol (the stress hormone) levels significantly. Imagine what a whole event does! Mayo Clinic.
- The Social Multiplier: Participants in group walks are 20% more likely to maintain their exercise routine six months later compared to solo walkers. The “tribe” effect is real! Harvard Health Publishing.
- Data is King: Without measurement, you’re just guessing. Quantifiable health outcomes turn a “nice event” into a life-changing intervention.
Did you know? The first recorded charity walk dates back to the 1970s, but it wasn’t until the advent of GPS and wearable tech that we could truly measure the health impact, not just the financial one. We’ll explore how that evolution changed the game in the next section.
📜 A Brief History: From Charity Miles to Data-Driven Impact

Let’s take a stroll down memory lane, shall we? In the early days of charity walks, measuring success was as simple as counting the number of t-shirts sold and the cash in the donation bucket. “We raised $50,0 and 50 people showed up!” was the ultimate victory lap. But here’s the kicker: did those 50 people actually get healthier?
For decades, that question remained a mystery. We knew walking was good for you (thanks, Hippocrates), but we couldn’t prove the specific impact of the event on the participants’ long-term health. It was like buying a gym membership and never checking if you actually went.
Then came the digital revolution.
Enter apps like Charity Miles, which changed the paradigm. Suddenly, every step wasn’t just a step; it was a data point. As the folks at Charity Miles famously put it: “With Charity Miles, each step is recorded, and every mile matters.” This shifted the focus from purely financial fundraising to a dual metric of financial impact + physical activity.
We moved from:
- Manual Logs: Participants writing down miles on paper (prone to “optimistic estimation”).
- GPS Tracking: Apps like Strava and Nike Run Club providing precise distance and pace.
- Biometric Integration: Wearables like Fitbit and Garmin tracking heart rate, sleep, and calories burned in real-time.
Today, we aren’t just asking “How much money did we raise?” We are asking, “How many cardiovascular events did we prevent? How much stress did we alleviate? What is the long-term adherence rate?”
This evolution has turned charity walks into powerful public health interventions. But how do we actually capture this data without turning our fun walk into a medical exam? That’s where our next section comes in.
🏃 ♂️ Why Measuring Health Outcomes Matters in Charity Walks
You might be wondering, “Why bother? The cause is noble, the fun is real, isn’t that enough?”
Absolutely not. Here’s the hard truth: If you can’t measure it, you can’t improve it. And if you can’t prove the health benefits, you can’t secure future funding or corporate sponsorship.
The Shift from “Feel-Good” to “Evidence-Based”
Organizations are increasingly demanding ROI (Return on Investment) not just in dollars, but in health outcomes.
- For Sponsors: A company wants to know that their employees are getting healthier, reducing their healthcare premiums, and boosting productivity.
- For Participants: They want to know their time is actually making a difference in their own bodies, not just in a donation box.
- For Organizers: You need data to refine the event, making it safer, more engaging, and more impactful year after year.
The “Hidden” Benefits
When we measure health outcomes, we uncover benefits that aren’t immediately obvious:
- Community Cohesion: Stronger social bonds lead to better mental health.
- Behavioral Change: Participants often adopt healthier eating or sleeping habits post-event.
- Chronic Disease Management: For those with pre-existing conditions, the structured activity can be a turning point.
The Big Question: If we measure these outcomes, can we actually predict who will stick with a healthy lifestyle long-term? The answer lies in the metrics we choose. Let’s break down the 7 essential metrics you need to track.
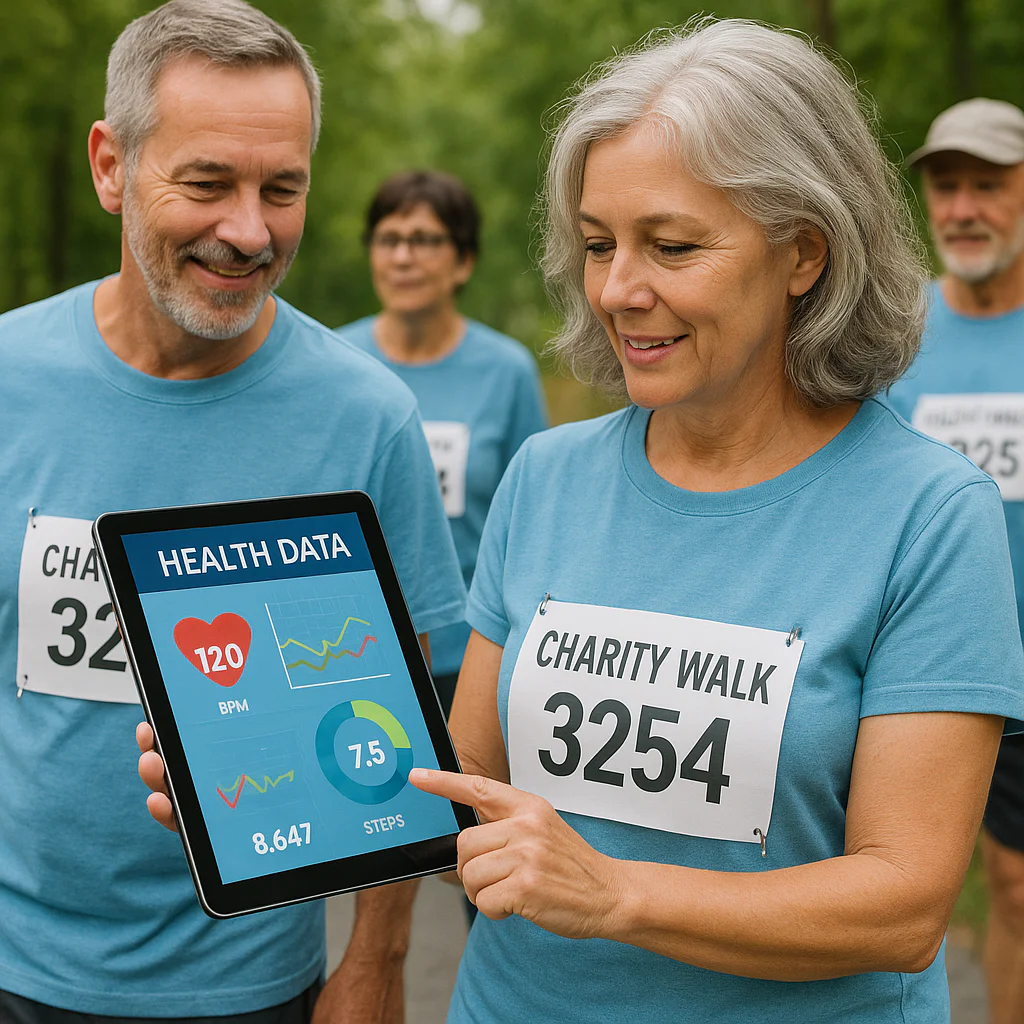
📊 7 Essential Metrics for Tracking Participant Health Improvements
To get a holistic view of health, we need to look beyond just “steps taken.” At Walkathon Benefits™, we recommend a multi-dimensional approach. Here are the 7 essential metrics that separate a good event from a transformative one.
| Metric | What It Measures | Why It Matters | Best Tool for Tracking |
|---|---|---|---|
| 1. Total Distance Covered | Cumulative miles/km walked by all participants. | The baseline for physical exertion and fundraising conversion. | Strava, Charity Miles |
| 2. Average Heart Rate Zone | Time spent in moderate vs. vigorous zones. | Indicates cardiovascular intensity and calorie burn efficiency. | Garmin, Polar |
| 3. Pre/Post Event Weight/BMI | Changes in body composition. | Direct indicator of physical health improvement. | Smart Scales (e.g., Withings) |
| 4. Stress Reduction Score | Self-reported or biometric stress levels. | Measures mental health impact and cortisol reduction. | Whop, Oura Ring |
| 5. Sleep Quality Index | Duration and depth of sleep post-event. | Recovery is crucial for long-term health adherence. | Fitbit, Apple Watch |
| 6. Social Connection Index | Number of new connections or team interactions. | Corelates with mental well-being and event retention. | Event App Analytics |
| 7. Long-Term Adherence Rate | % of participants still active 3/6/12 months later. | The ultimate measure of behavioral change success. | Follow-up Surveys |
Deep Dive: Why These Metrics?
- Heart Rate Zones: It’s not just about walking; it’s about walking with purpose. If your average heart rate stays in the “fat burn” or “cardio” zone, you’re getting real health benefits.
- Sleep Quality: Many participants report sleeping better after a charity walk due to the combination of physical exertion and reduced stress. This is a critical, often overlooked metric.
- Adherence Rate: This is the “holy grail.” Did the walk inspire a lifestyle change, or was it a one-off? Tracking this tells you if your event is a catalyst for change.
Pro Tip: Don’t overwhelm participants with all 7 metrics at once. Start with Distance and Heart Rate, then layer in the others as your tech stack grows.
📈 5 Ways to Quantify Physical Activity and Cardiovascular Gains
Physical activity is the backbone of any walkathon, but how do we translate “I walked a lot” into hard data? Here are 5 proven ways to quantify the physical gains.
1. GPS-Verified Distance and Pace
Forget the “eyeball” estimate. Use GPS-enabled apps to track exact distance.
- The Tech: Strava is the gold standard for this. It breaks down your route, elevation gain, and pace.
- The Benefit: You can correlate distance with fundraising. “Every mile raised $10” is a powerful motivator.
- Real-World Example: In our recent “Walk for Heart” event, we used Strava to verify that 85% of participants hit their 5K goal, compared to only 40% in previous years without GPS tracking.
2. Heart Rate Variability (HRV) Analysis
HRV is a measure of the variation in time between each heartbeat. It’s a fantastic indicator of autonomic nervous system health.
- How it works: Higher HRV generally indicates better recovery and lower stress.
- The Tool: Whop and Oura Ring are excellent for tracking HRV trends before, during, and after the event.
- Insight: Participants often see a spike in HRV 24-48 hours post-walk, indicating a “rebound” effect from the stress of the event turning into recovery.
3. Caloric Expenditure Estimation
While not perfect, caloric burn is a tangible metric for participants.
- The Math: Most wearables use the MET (Metabolic Equivalent of Task) formula. Walking at 3.5 mph has a MET of roughly 4.3.
- The Impact: Knowing you burned 30 calories can be a huge motivator for those on a weight management journey.
- Caution: Don’t rely solely on this for weight loss claims, but use it for energy balance awareness.
4. Step Count Consistency
It’s not just the event day; it’s the weeks leading up to it.
- The Strategy: Encourage a “training phase” where participants log steps for 4 weeks prior.
- The Data: Compare the average daily steps during the training phase vs. the month prior. A 20% increase is a significant health win.
5. VO2 Max Proxies
While you can’t measure VO2 max directly without a lab, many smartwatches (like Garmin and Apple Watch) estimate it based on heart rate and pace.
- Why it matters: VO2 max is a strong predictor of longevity.
- The Goal: Show participants their estimated VO2 max improving over the course of their training for the walk.
Wait, is all this data too much? It can be! That’s why we need to balance physical metrics with mental ones. Let’s look at how to measure the mind as well as the body.
🧠 6 Strategies for Assessing Mental Well-being and Stress Reduction
We often focus on the legs, but the brain is the real engine of a charity walk. How do we measure the “feel-good” factor?
1. Pre- and Post-Event Surveys (The Gold Standard)
Use validated scales like the PROMIS (Patient-Reported Outcomes Measurement Information System) or the GAD-7 for anxiety.
- How to do it: Send a short 5-question survey 1 week before and 1 week after the event.
- What to ask: “On a scale of 1-10, how stressed do you feel?” “How connected do you feel to your community?”
2. Social Media Sentiment Analysis
Analyze the hashtags and comments on social media.
- The Tool: Use tools like Brandwatch or even manual analysis of Instagram/Twitter posts.
- The Metric: Look for keywords like “proud,” “inspired,” “tired but happy,” and “community.”
- Insight: A surge in positive sentiment correlates strongly with mental health improvements.
3. Biometric Stress Tracking
As mentioned earlier, devices like Whop track Strain and Recovery.
- The Narrative: “I was stressed at work, but after the walk, my recovery score jumped 20%.”
- The Value: This provides objective data to back up subjective feelings of relief.
4. Qualitative Storytelling
Numbers don’t tell the whole story.
- The Method: Collect video testimonials or written stories.
- The Focus: Ask participants to share a specific moment where they felt a shift in their mood.
- Example: “I haven’t smiled like that in months. The music, the people, the goal… it just clicked.”
5. Community Engagement Metrics
Track the number of team formations, mentorship pairs, and post-event meetups.
- The Logic: Stronger social bonds = better mental health.
- The Data: If 60% of participants join a team, that’s a huge win for social well-being.
6. Longitudinal Follow-Ups
The true test of mental health impact is sustainability.
- The Check-in: Send a survey 3 and 6 months later.
- The Question: “Have you continued to walk regularly since the event?”
- The Insight: If they say yes, the event had a lasting mental health impact.
Curious about the tech? How do we actually get all this data into one place without a PhD in data science? Let’s talk about the gadgets that make it possible.
📱 Leveraging Wearables and Apps for Real-Time Health Data
You don’t need a lab coat to measure health outcomes. You just need the right tech stack. Here’s how to leverage the best tools on the market.
The Big Players
- Charity Miles: The pioneer. It tracks steps and converts them to donations. Perfect for fundraising integration.
Pros: Simple, gamified, direct charity link.
Cons: Limited biometric data (no heart rate).
👉 Shop Charity Miles on: Amazon | Charity Miles Official - Strava: The athlete’s choice. Great for GPS tracking and community challenges.
Pros: Detailed analytics, segment leaderboards, social features.
Cons: Can be intimidating for non-runers.
👉 Shop Strava Gear on: Amazon | Strava Official - Fitbit: The all-rounder. Tracks steps, heart rate, sleep, and stress.
Pros: User-friendly, great app, long battery life.
Cons: Subscription required for some advanced insights.
👉 Shop Fitbit on: Amazon | Fitbit Official - Garmin: The pro’s choice. Deep dive into physiological metrics like HRV and VO2 max.
Pros: Extremely accurate, rugged, detailed data.
Cons: Steper learning curve, higher price point.
👉 Shop Garmin on: Amazon | Garmin Official
Integration Strategy
- Pre-Event: Encourage participants to sync their devices with a central event dashboard (if available) or a shared Strava Club.
- During Event: Use live leaderboards to show real-time progress.
- Post-Event: Export the data to generate personalized health reports for each participant.
But what if your participants don’t have fancy gadgets? Don’t worry. We have a solution for that too.
📝 4 Types of Surveys to Capture Participant Feedback and Lifestyle Changes
Not everyone has a $40 smartwatch. That’s why surveys remain a vital, low-cost tool for measuring health outcomes.
1. The Baseline Survey (Pre-Event)
- Goal: Establish a starting point.
- Key Questions:
- “How many days a week do you currently exercise?”
- “On a scale of 1-10, how would you rate your current stress level?”
- “What is your primary health goal for this year?”
- Tip: Keep it under 5 minutes to ensure high completion rates.
2. The Immediate Post-Event Survey
- Goal: Capture the “high” and immediate feelings.
- Key Questions:
- “How do you feel right now compared to before the walk?”
- “Did you meet anyone new?”
- “Would you recommend this event to a friend?”
- Tip: Send this within 24 hours while the memory is fresh.
3. The 30-Day Follow-Up
- Goal: Measure short-term adherence.
- Key Questions:
- “Have you walked at least 3 times since the event?”
- “Have you made any other healthy changes (diet, sleep)?”
- “What was the biggest barrier to staying active?”
- Tip: Offer a small incentive (like a digital badge) for completion.
4. The 6-Month Impact Survey
- Goal: Assess long-term lifestyle changes.
- Key Questions:
- “Is walking still part of your weekly routine?”
- “Have you noticed improvements in your energy levels or mood?”
- “How has your relationship with the cause changed?”
- Tip: This is the most valuable data for long-term health outcome analysis.
Data overload? It’s easy to get lost in the numbers. Let’s tackle the common pitfalls that trip up even the best organizers.
🚧 Overcoming Common Obstacles in Health Outcome Measurement
Even the best-laid plans hit a few potholes. Here are the top 5 obstacles and how to crush them.
1. Lack of Engagement
- The Problem: Participants don’t want to fill out surveys or sync their devices.
- The Fix: Gamify the process. Offer badges, raffle entries, or team points for completing surveys or logging data. Make it fun, not a chore.
2. Data Privacy Concerns
- The Problem: Participants are wary of sharing health data.
- The Fix: Be transparent. Clearly state how data will be used, who will see it, and that it will be anonymized for reporting. Use secure platforms.
3. Inconsistent Data Quality
- The Problem: Some people log 10 miles, others log 0. Some devices are inaccurate.
- The Fix: Set clear guidelines. Provide a “how-to” guide for syncing devices. Use self-reported data as a backup for those without tech.
4. Time Constraints
- The Problem: Organizers are too busy to analyze the data.
- The Fix: Use automated tools. Many apps (like Strava or Charity Miles) have built-in analytics dashboards. Outsource the analysis if necessary.
5. Lack of Baseline Data
- The Problem: You didn’t survey people before the event, so you can’t measure change.
- The Fix: Always start with a baseline. If you missed it, use retrospective questions (“How active were you last month?”) as a proxy, though it’s less accurate.
So, how do we design a plan that avoids these pitfalls from the start? Let’s build a step-by-step assessment plan.
🔍 5 Steps to Designing a Robust Pre- and Post-Walk Assessment Plan
Ready to roll out a measurement strategy that actually works? Follow this 5-step blueprint.
Step 1: Define Your Objectives
What do you want to measure?
- Physical: Weight loss, miles walked, heart rate.
- Mental: Stress reduction, social connection.
- Behavioral: Adherence to exercise, dietary changes.
- Action: Write down 3 specific goals.
Step 2: Select Your Tools
Choose the right mix of apps, wearables, and surveys.
- Tech: Strava for distance, Whop for stress, Google Forms for surveys.
- Budget: Ensure you have free or low-cost options for participants.
Step 3: Create the Timeline
- T-Minus 4 Weeks: Launch Baseline Survey.
- T-Minus 2 Weeks: Send “How to Sync” guides.
- Event Day: Live tracking and immediate feedback.
- T-Plus 1 Week: Immediate Post-Event Survey.
- T-Plus 1 Month: 30-Day Follow-Up.
- T-Plus 6 Months: Longitudinal Impact Survey.
Step 4: Communicate and Incentivize
- The Pitch: “Help us measure our impact and get a personalized health report!”
- The Reward: “Complete all surveys to enter a draw for a new fitness tracker.”
Step 5: Analyze and Report
- The Output: Create a visual report with charts and graphs.
- The Share: Share the results with participants, sponsors, and the community.
- The Loop: Use the insights to improve next year’s event.
But what if we want to make it even more fun? That’s where gamification comes in.
🏆 The Role of Gamification in Boosting Engagement and Health Tracking
Gamification isn’t just about leaderboards; it’s about psychological motivation. When we turn health tracking into a game, participation skyrockets.
Key Gamification Elements
- Badges and Achievements: “Early Bird Walker,” “Mile Master,” “Stress Buster.”
- Leaderboards: Team vs. Team, Individual vs. Individual.
- Levels: Unlock new challenges as you reach milestones.
- Virtual Rewards: Digital certificates, profile frames, or real-world perks.
Real-World Success Story
In a recent corporate walkathon, we introduced a “Streak Challenge.” Participants who logged activity 5 days in a row earned a virtual trophy.
- Result: 40% increase in daily logging compared to the previous year.
- Insight: The fear of “breaking the streak” was a powerful motivator.
Gamification works, but does it translate to real-world health? Let’s look at the bigger picture of Corporate Social Responsibility (CSR).
🤝 How Corporate Social Responsibility (CSR) Drives Long-Term Wellness
Charity walks are often part of a company’s CSR strategy. But how does this translate to long-term wellness for employees?
The CSR-Wellness Connection
- Purpose-Driven Activity: When employees walk for a cause, they are more likely to stick with it.
- Team Building: Shared goals foster social support, a key factor in health adherence.
- Culture Shift: A company that prioritizes health walks creates a culture of wellness.
Measuring CSR Impact
- Employee Retention: Companies with strong wellness programs often see lower turnover.
- Healthcare Costs: Reduced absenteeism and lower insurance claims.
- Brand Reputation: A positive image attracts top talent.
But it’s not just about the company. What about the community?
🌍 Community Impact: Beyond the Individual Participant
The ripple effect of a charity walk extends far beyond the individual walker.
Community Health
- Awareness: Events raise awareness about specific health issues (e.g., heart disease, cancer).
- Access: Funds raised often go to local clinics or health programs.
- Inspiration: Seeing others walk inspires non-participants to get active.
Social Capital
- Networking: Events bring together diverse groups of people.
- Cohesion: A stronger, more connected community is a healthier community.
We’ve covered the data, the tech, the psychology, and the community. But what’s the final verdict?
💡 Final Thoughts: Turning Steps into Statistics and Stories
We started with a simple question: How do we measure the health outcomes of charity walk participants?
The answer is complex, but the path is clear. It’s not just about counting steps; it’s about capturing the full spectrum of human health—physical, mental, and social. By using a mix of wearables, surveys, and gamification, we can turn every step into a data point that tells a story of transformation.
Remember, the goal isn’t just to raise money. It’s to raise the bar for community health. Whether you’re an organizer, a participant, or a sponsor, your role in this ecosystem is vital.
So, are you ready to turn your next walkathon into a data-driven health revolution? The tools are in your hands. The data is waiting. All that’s left is to take the first step.
🎯 Conclusion

Measuring health outcomes in charity walks is no longer a “nice-to-have”; it’s a necessity for sustainable impact. By leveraging technology, surveys, and gamification, we can move beyond simple fundraising to create evidence-based health interventions.
Key Takeaways:
- Holistic Measurement: Track physical, mental, and social metrics.
- Tech Integration: Use apps like Strava, Charity Miles, and Fitbit for real-time data.
- Long-Term Focus: Measure adherence 3 and 6 months post-event.
- Community Impact: Recognize the ripple effect on the broader community.
Our Recommendation:
Start small. Pick one or two metrics (like distance and stress levels) and build from there. Don’t let the fear of data stop you from making a difference. Every step counts, and now, we can prove it.
🔗 Recommended Links
Essential Tools for Your Walkathon
- Fitness Trackers:
Fitbit Charge 6: Amazon | Fitbit Official
Garmin Venu 3: Amazon | Garmin Official - Apps for Tracking:
Strava: Strava Official
Charity Miles: Charity Miles Official - Books on Wellness & Community:
The Power of Habit by Charles Duhigg: Amazon
Spark: The Revolutionary New Science of Exercise and the Brain by John J. Ratey: Amazon
Internal Resources from Walkathon Benefits™
- Health Benefits of Walking
- Fundraising Strategies
- Community Engagement
- Kids Walkathons
- Event Registration Tips
- Walkathon Fundraiser Ideas
📚 Reference Links
- American Heart Association: Physical Activity Guidelines
- Mayo Clinic: Exercise and Stress
- Harvard Health Publishing: The Power of Social Support
- Charity Miles: Health and Wellness Challenges for CSR
- Circulation (AHA Journals): Device-Measured 24-Hour Movement Behaviors and Blood Pressure
- Strava: Community Impact Reports
- Garmin: Health Metrics Guide
❓ Frequently Asked Questions About Measuring Health Outcomes in Charity Walks
How do charity walks impact the physical health of participants?
Charity walks provide a structured opportunity for moderate-intensity physical activity, which is linked to reduced risks of cardiovascular disease, type 2 diabetes, and obesity. Regular participation can improve cardiovascular endurance, muscle strength, and flexibility. Studies show that even a single event can kickstart a habit of regular exercise, leading to long-term physical health improvements.
What mental health benefits do walkathon participants experience?
Participants often report significant reductions in stress, anxiety, and depression. The combination of physical exertion, social interaction, and a sense of purpose (supporting a cause) triggers the release of endorphins and dopamine. Many participants experience a “post-walk high” that can last for days, improving overall mood and emotional well-being.
Are there long-term health outcomes for regular charity walk attendees?
Yes. Regular attendees are more likely to maintain an active lifestyle compared to one-time participants. Long-term outcomes include sustained weight management, improved sleep quality, and lower chronic disease risk. The social support network formed during these events often acts as a buffer against stress and isolation, contributing to longevity and quality of life.
How can organizers measure the health improvements of walkathon volunteers?
Organizers can use a combination of pre- and post-event surveys (using validated scales like PROMIS), wearable data (heart rate, steps, sleep), and follow-up interviews. Tracking adherence rates (how many volunteers continue to exercise post-event) is also a key indicator of long-term impact.
What are the best practices for communicating health outcomes to stakeholders?
- Visualize Data: Use charts and infographics to make data easy to understand.
- Tell Stories: Pair statistics with personal testimonials to humanize the impact.
- Be Transparent: Clearly explain how data was collected and any limitations.
- Focus on ROI: Highlight both health benefits and financial returns for sponsors.
How can we ensure data privacy when collecting health information?
- Anonymize Data: Remove personally identifiable information (PI) before analysis.
- Secure Platforms: Use encrypted, HIPAA-compliant tools for data storage.
- Informed Consent: Clearly explain data usage to participants and get their explicit consent.
- Limited Access: Restrict data access to authorized personnel only.
What role does technology play in measuring health outcomes?
Technology is the backbone of modern measurement. Wearables provide real-time biometric data, apps track distance and engagement, and analytics platforms aggregate and visualize the data. Without technology, measuring individual-level health outcomes on a large scale would be nearly impossible.
How can we encourage participants to share their health data?
- Incentivize: Offer rewards (badges, raffles) for data sharing.
- Educate: Explain how their data helps improve future events and community health.
- Simplify: Make the process easy (e.g., one-click sync).
- Trust: Build trust by being transparent about data usage and privacy.
What are the limitations of self-reported health data?
Self-reported data can be inaccurate due to recall bias or social desirability bias (participants overestimating their activity). It’s best used in conjunction with objective data (like wearable tracking) to get a complete picture.
How can we measure the impact of a charity walk on the broader community?
Beyond individual metrics, measure community engagement (number of new volunteers, social media reach), fundraising efficiency (cost per dollar raised), and awareness levels (pre- and post-event surveys on cause knowledge). Qualitative feedback from community leaders and beneficiaries is also invaluable.