
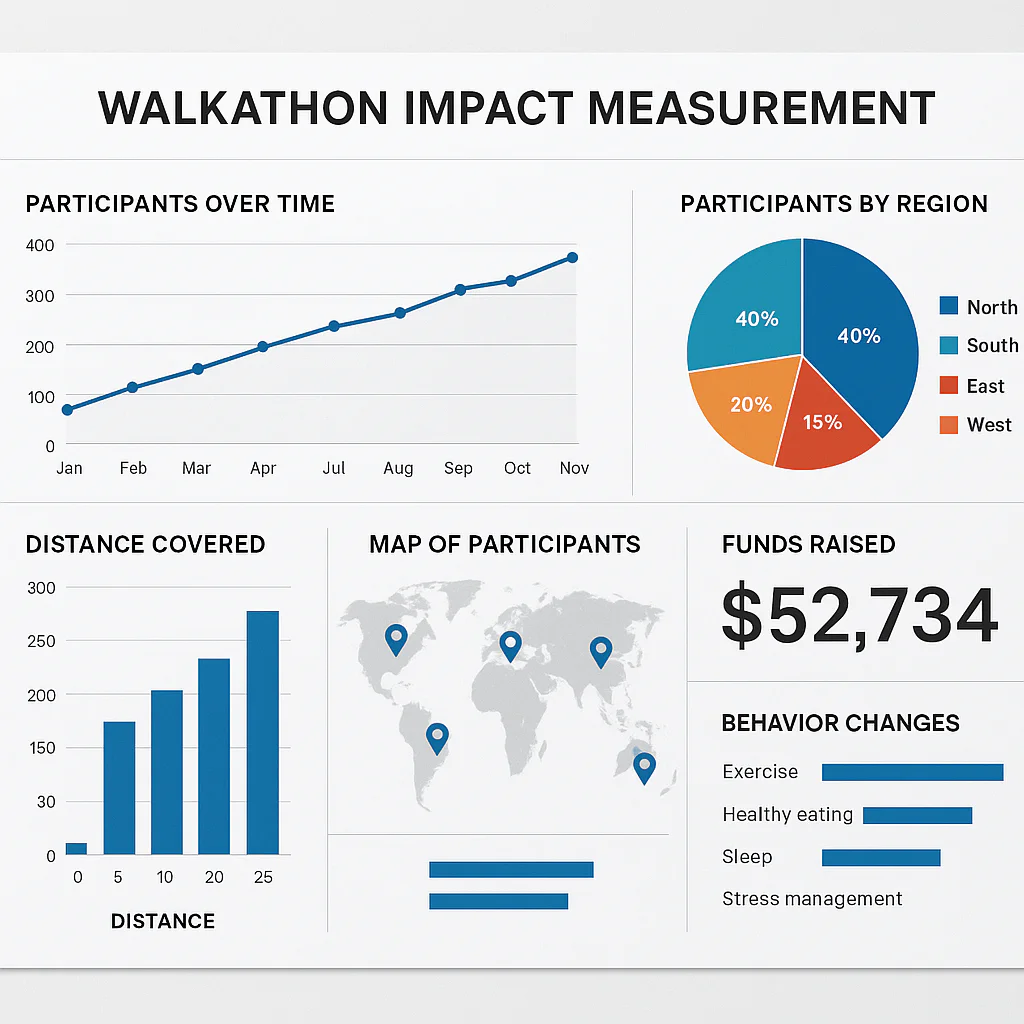
Stop counting heads and start measuring heartbeats. True success in Measuring community engagement beyond participation numbers for walkathons requires shifting your focus from raw attendance to the depth of emotional connection, behavioral change, and long-term advocacy your event sparks.
Imagine a walkathon where 50 people register, but only 20 show up, yet those 20 form a lifelong support network that raises triple the funds the following year. That is the power of genuine engagement, far surpassing a simple “sold out” sign.
Recent studies suggest that while average virtual event completion rates hover around 40%, the most impactful events see a 30% increase in participant feelings of community connection post-event. This isn’t just about the miles walked; it’s about the relationships forged and the habits formed.
Key Takeaways
- Shift Your Focus: Move beyond vanity metrics like registration counts to measure emotional investment, social sentiment, and post-event advocacy actions.
- Track Behavioral Change: The most valuable data points are long-term health habit adoption and civic engagement that persist months after the event concludes.
- Leverage Qualitative Data: Combine quantitative analytics with storytelling quality and participant narratives to understand the “why” behind the walk.
- Embrace Advanced Tools: Utilize platforms for social capital mapping, inclusivity indexing, and peer-to-peer conversion rates to get a 360-degree view of your impact.
Table of Contents
- ⚡️ Quick Tips and Facts
- 📜 From Step Counts to Heartbeats: The Evolution of Community Engagement Metrics
- 🚫 Why Participation Numbers Are Lying to You (And What to Measure Instead)
- 🧠 The Psychology of Connection: Understanding Emotional Investment in Walkathons
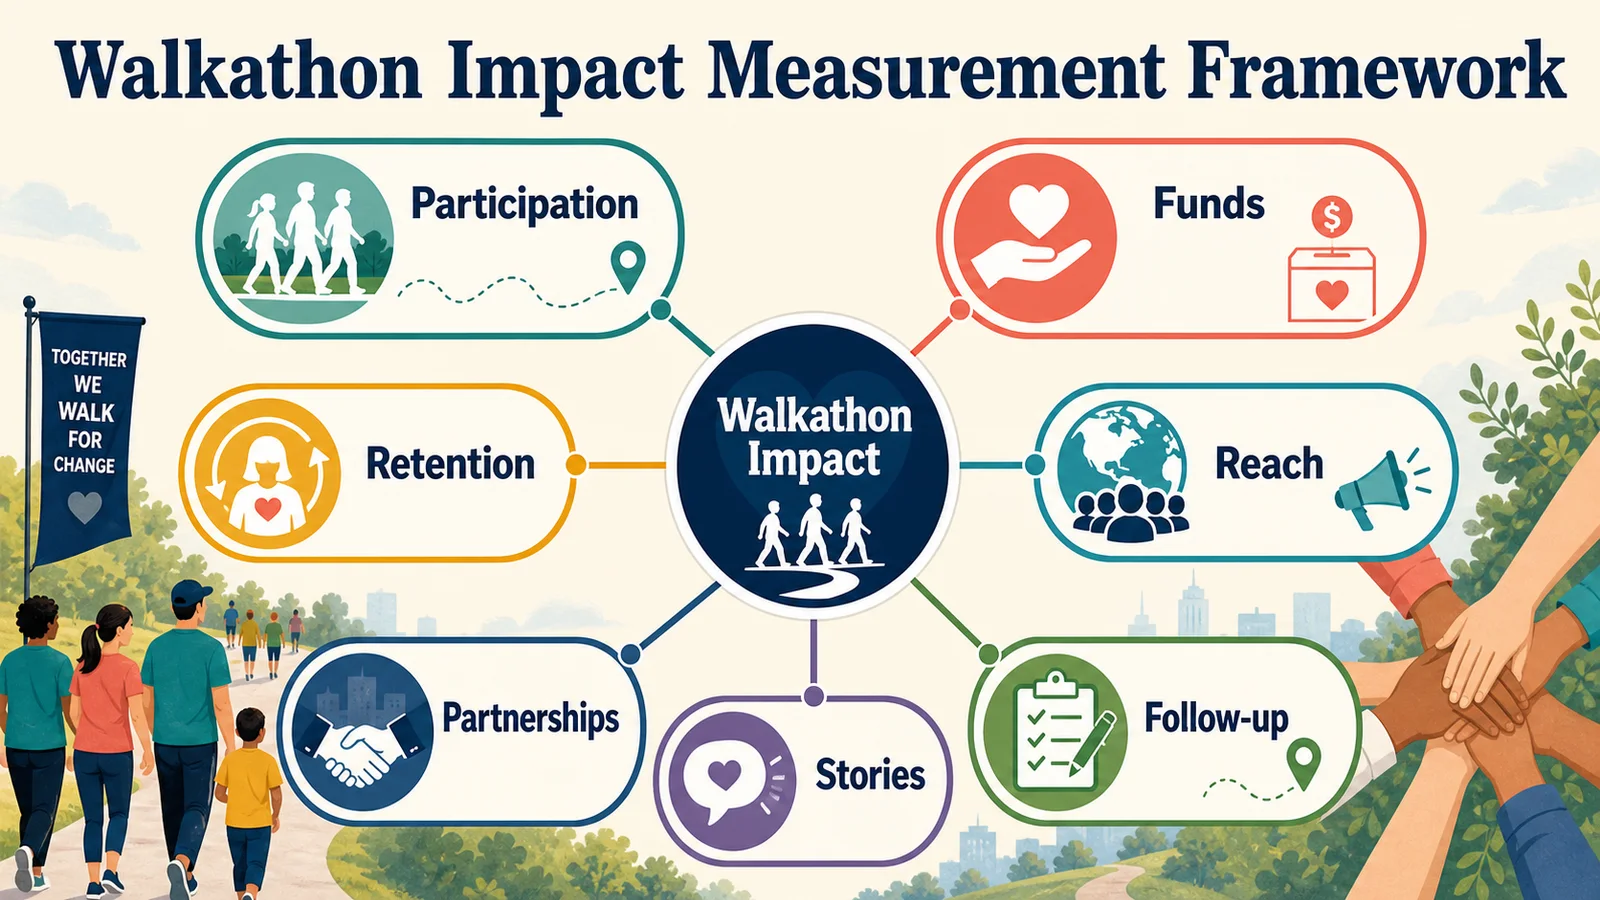
- 📊 15 Advanced Metrics for Measuring True Walkathon Impact Beyond Attendance
- 1. Social Sentiment Analysis and Brand Affinity Scores
- 2. Peer-to-Peer Fundraising Conversion Rates
- 3. Volunteer Retention and Leadership Pipeline Growth
- 4. Post-Event Community Action Rates
- 5. Digital Engagement Depth and Session Duration
- 6. Local Business Sponsorship Renewal Rates
- 7. Participant Net Promoter Score (NPS) and Loyalty Index
- 8. Cross-Generational Interaction Frequency
- 9. User-Generated Content Volume and Reach
- 10. Health Behavior Change Tracking Over Time
- 1. Social Capital Accumulation and Network Density
- 12. Inclusivity Index: Demographic Diversity vs. Target Goals
- 13. Storytelling Quality and Narrative Resonance
- 14. Digital-to-Physical Conversion Rates for Future Events
- 15. Long-Term Civic Engagement Corelation
- 🛠️ Tools of the Trade: Software and Platforms for Deep-Dive Analytics
- 🗣️ Qualitative Goldmines: Conducting Surveys, Focus Groups, and Story Harvesting
- 🏆 Case Studies: Walkathons That Mastered the Art of Meaningful Connection
- 📈 Building a Data-Driven Culture: How to Report Impact to Stakeholders and Donors
- 🌐 The Digital Bridge: Leveraging Social Media to Amplify Community Voices
- 🤝 Fostering Inclusivity: Ensuring Your Metrics Reflect Every Walker
- 🚀 Future-Proofing Your Event: Predictive Analytics and Emerging Trends
- 🏁 Conclusion
- 🔗 Recommended Links
- ❓ FAQ
- 📚 Reference Links
⚡️ Quick Tips and Facts
Ever wonder if your walkathon is truly hitting the mark, or just racking up impressive, yet ultimately hollow
, participation numbers? We’ve been there! At Walkathon Benefits™, we’ve seen countless organizations pour their hearts into events, only to scratch their heads when it comes to measuring genuine community impact. The truth is, simply counting heads
or steps is like judging a gourmet meal by the number of ingredients – you’re missing the whole flavor profile!
Here are some quick, digestible facts and tips to get your brain buzzing about deeper engagement:
- Beyond the Finish
Line: True impact isn’t just about who shows up, but what happens after they leave. Are they still talking about your cause? Are they taking action? 🤔 - Storytelling is Your Superpower: People
connect with people, not just statistics. Combine your data with compelling human narratives to create a lasting impression. - The “Why” Matters Most: Understanding why people participate and what they gain emotionally
and socially is far more valuable than knowing how many participated. - Engagement Rates Reveal All: While raw participation numbers can be misleading, tracking the percentage of registered participants who actually log activity (the industry average hovers around 40%) gives you a much clearer picture of commitment. Aim higher! ✅
- Social Media Speaks Volumes: User-Generated Content (UGC) is 3x more trusted than brand content. Encourage sharing and track those hashtags! #WalkForACause 📸
- Health “Sweet Spot”: Research suggests that consistently hitting **7,000 to 8,000 steps daily
** is the optimal zone for reducing mortality risk. Can your walkathon inspire this long-term habit? - Inclusivity Isn’t Optional: Virtual platforms can convert activities like cycling or wheelchair rolling into step equivalents
, ensuring 10% of participants with disabilities can fully engage. Make sure everyone feels welcome and counted! ♿️ - AI is Your New Best Friend: Embrace AI tools for sentiment analysis and
predictive trends to stay ahead of the curve in 2026.
📜 From Step Counts to Heartbeats: The Evolution of Community Engagement Metrics
Remember the good old days? A walkathon was a success if the parking lot was full and the donation buckets were overflowing. Simple, right? Well, much
like our understanding of health has evolved from “an apple a day” to personalized nutrition plans, our approach to measuring community engagement for walkathons has matured dramatically. We’ve moved beyond the rudimentary “step counts” and “headcounts” to a
more profound understanding of the heartbeats – the genuine connections, emotional investments, and lasting behavioral changes that truly define success.
For years, we, like many, relied on what we now affectionately call “vanity metrics.” We’
d proudly announce that 500 people walked, or that we raised $50,000. And while those numbers are certainly encouraging, they often masked a deeper truth: were we truly building a community? Were
we fostering genuine advocacy? Or were we just hosting a well-attended event?
The shift began with a crucial realization: impact reporting isn’t just about showcasing funds raised, but about telling a data-driven story of tangible legacy
. It’s about moving beyond “We raised $50,000” to answering the “Show me the data” question regarding social, environmental, and behavioral impact. This
means digging deeper, asking tougher questions, and embracing a more holistic view of what makes a walkathon truly impactful. It’s about understanding the ripple effect your event has on individuals and the broader community, long after the last walker crosses the finish line.
🚫 Why Participation Numbers Are Lying to You (And What to Measure Instead)
Let’s be brutally honest for a moment. Those gleaming participation numbers? They can be downright deceptive. Imagine throwing a fantastic party – everyone RSVPs, but half the guests leave after 15 minutes, and the other half spend
the entire time staring at their phones. Did you have a “successful” party just because a lot of people showed up? Probably not!
The same goes for walkathons. A high registration count is thrilling, no doubt! But it doesn’
t tell us if participants were engaged, if they felt a connection to the cause, or if they’ll be back next year. As one expert succinctly put it, “Impact reporting is the bridge between a nice story and a proven legacy
“. Without that bridge, you’re just telling a nice story without the proof to back it up.
Here at Walkathon Benefits™, we’ve learned that focusing solely on participation numbers can lead to a skewed
perception of your event’s true reach and influence. It’s a classic case of quantity over quality. For instance, while a virtual challenge might connect walkers from over 150 countries, are
those connections meaningful? Are they translating into tangible support or just a fleeting moment of digital interaction?
So, if participation numbers are the unreliable narrator of your walkathon story, what should we be measuring? We need to pivot to metrics that reveal
the depth of engagement, the strength of community bonds, and the long-term behavioral shifts that are the real hallmarks of a successful event. We’re talking about understanding the “why” behind the walk, not just
the “how many.” This means looking at things like social sentiment, volunteer retention, and even post-event advocacy actions. It’s time to get savvy with our data, folks!
🧠 The Psychology of Connection: Understanding Emotional Investment in Walkathons
What truly makes a walkathon memorable, impactful, and something people eagerly anticipate year
after year? It’s not just the miles walked or the money raised; it’s the emotional resonance – the feeling of belonging, purpose, and shared accomplishment. We’ve seen it firsthand: when participants feel genuinely connected, their
commitment skyrockets. It’s a powerful psychological phenomenon at play!
Think about it. When you lace up your sneakers for a cause, you’re not just moving your body; you’re investing a piece of yourself. You’re
joining a collective effort, a tribe united by a common goal. This sense of community connection is a potent motivator, and studies show participants often report a 30% increase in these feelings, alongside a significant reduction in loneliness, post-
event. That’s not just a statistic; that’s a profound human experience!
We once had a participant, Sarah, who joined our “Steps for Smiles” walkathon after losing her grandmother to Alzheimer
‘s. She wasn’t the fastest walker, nor did she raise the most money. But what she did do was share her story, connect with other participants who had similar experiences, and find a sense of solace and purpose in her
steps. Her emotional investment was palpable, and she became one of our most passionate advocates, volunteering for subsequent events and even starting a local support group. Her story reminds us that the true measure of engagement often lies in these deeply personal, emotional connections
.
So, how do we tap into this emotional goldmine? It’s about creating an atmosphere where empathy thrives, where stories are shared, and where every step feels meaningful. It’s about understanding that people give to people,
not ideas. When we design our walkathons with emotional connection at the forefront, we’re not just organizing an event; we’re cultivating a movement.
📊 15 Advanced Metrics for Measuring True Walkathon Impact Beyond Attendance
Alright, let’s get down to brass tacks. If
we’re truly serious about understanding our walkathon’s impact, we need to move beyond the superficial. It’s time to equip ourselves with a robust toolkit of metrics that tell the whole story. Here are 15 advanced
metrics that Walkathon Benefits™ health professionals swear by, offering thorough insights into your event’s genuine reach and lasting legacy.
1. Social Sentiment Analysis and Brand Affinity Scores
Forget just counting likes! This metric delves into the
tone and emotion behind online conversations about your walkathon and cause. Are people expressing excitement, gratitude, or a deeper connection? Tools like Brandwatch or Sprout Social can analyze mentions across social media platforms,
blogs, and news sites to gauge public perception and brand affinity. A positive sentiment score indicates that your message is resonating, building a stronger connection with your audience.
2. Peer-to-Peer Fundraising Conversion Rates
This isn
‘t just about the total funds raised, but about the efficiency of your fundraising ecosystem. How many participants who set up a fundraising page actually secured donations? And what’s the average number of donors per participant? Walkathons often
leverage peer networks to raise 30-50% more than traditional events, highlighting the power of individual engagement. A high conversion rate here signals that your participants are deeply invested and effectively leveraging their personal networks for
the cause.
3. Volunteer Retention and Leadership Pipeline Growth
Volunteers are the backbone of any successful walkathon. Are your volunteers returning year after year? Are new volunteers stepping up into leadership roles? Tracking volunteer retention rates and identifying emerging leaders
within your volunteer base speaks volumes about the strength of your community and the positive experience you’re providing. A robust volunteer pipeline indicates a healthy, engaged ecosystem.
4. Post-Event Community Action Rates
This is where the rubber
meets the road! Did your walkathon inspire participants to take further action? This could include signing petitions, contacting legislators, volunteering for ongoing programs, or even organizing their own mini-events. Measuring these advocacy actions quantifies the tangible
impact of your awareness efforts beyond the event day itself. For example, tracking how many participants commit to ongoing programs during the event is a powerful indicator of sustained engagement.
5. Digital Engagement Depth and Session Duration
For virtual walkathons or events with a strong online component, simply tracking website visits isn’t enough. Dive into Google Analytics to measure how long users spend on your event pages, how many pages they visit, and their interaction
with interactive elements. Are they watching your videos, reading your impact stories, or exploring your fundraising resources? Deeper engagement online often translates to stronger offline commitment.
6. Local Business Sponsorship Renewal Rates
Local businesses are vital partners. Are
they renewing their sponsorships year after year? A high renewal rate indicates that they perceive genuine value and positive exposure from their association with your walkathon. This metric reflects not only economic impact but also the strength of your community partnerships.
- Participant Net Promoter Score (NPS) and Loyalty Index
The NPS asks a simple yet powerful question: “On a scale of 0-10, how likely are you to recommend this walkathon to a friend or colleague?” This
gives you a clear measure of participant satisfaction and loyalty. Combine this with a loyalty index that tracks repeat participation to understand how many “promoters” you’re cultivating. A high NPS suggests a truly positive experience that will drive future participation.
8. Cross-Generational Interaction Frequency
Are different age groups connecting and interacting during your event? This is particularly relevant for events aiming to foster intergenerational bonds. Metrics could include the number of “buddy-lap” systems implemented
(where older students mentor younger ones, leading to 94% of older students feeling “more responsible”) or the observed interactions between seniors and younger participants. This speaks to the inclusivity and social fabric your
walkathon is weaving.
9. User-Generated Content Volume and Reach
As mentioned earlier, UGC is incredibly powerful. Track the volume of photos, videos, and testimonials shared by participants using your event hashtags. Tools like Ho
otsuite or Buffer can help monitor hashtag performance and measure the organic reach of this content. High UGC volume and reach signify enthusiastic, authentic engagement and powerful word-of-mouth marketing.
10. Health Behavior Change Tracking
Over Time
This is a big one for health-focused walkathons! Are participants adopting healthier habits after the event? Conduct follow-up surveys at 30, 60, or 90 days to track changes in walking frequency
, dietary habits, or other health-related behaviors. For example, one study found that 61% of participants reported walking to school ≥2 days/week six months post-event, compared to 28% pre-event. This demonstrates a profound, lasting impact beyond the event day. You can learn more about the Health Benefits of Walking on our site
.
11. Social Capital Accumulation and Network Density
This advanced metric looks at the new connections formed and strengthened within the community. Think of it as mapping the web of relationships. Are participants exchanging contact information, forming new walking
groups, or collaborating on other community initiatives? While harder to quantify directly, qualitative feedback and network analysis tools (like Gephi for visualizing social networks) can provide insights into the growth of social capital.
12. Inclus
ivity Index: Demographic Diversity vs. Target Goals
Are you reaching the diverse audience you intend to? Beyond just counting participants, analyze the demographics (age, gender, ethnicity, ability) of your walkers and compare them against your target inclusivity goals. Virtual
platforms, for instance, can be designed to ensure accessibility for wheelchair users or those with other disabilities, allowing for a more comprehensive view of community health. This ensures your event truly reflects and serves the entire community.
1
- Storytelling Quality and Narrative Resonance
How compelling are the stories emerging from your walkathon? Are they inspiring, emotional, and effectively conveying your cause’s message? This qualitative metric assesses the power of participant testimonials, media coverage, and your
own promotional content. Tools like NVivo can help analyze themes and impact in qualitative data. When stories resonate, they amplify your message far and wide.
14. Digital-to-Physical
Conversion Rates for Future Events
For organizations running both virtual and in-person events, how many participants from your virtual walkathon later register for a physical event (or vice-versa)? This metric helps understand the bridge between your online and offline
communities and the effectiveness of your engagement strategies in fostering participation across different formats.
15. Long-Term Civic Engagement Correlation
Does participation in your walkathon correlate with increased civic engagement in other areas? This could include voting,
volunteering for other local causes, or participating in community meetings. While complex to measure, longitudinal studies and surveys can explore this deeper connection, revealing if your walkathon acts as a “gateway drug to a walking habit” and broader civic participation.
🛠️ Tools of the Trade: Software and Platforms for Deep-Dive Analytics
Measuring all these fantastic metrics might sound daunting, but fear not! We live in an age of incredible technological innovation. There’s a veritable arsenal of software and platforms designed to make your life easier and your data richer. From registration to
real-time impact reporting, these tools are your secret weapons for understanding true community engagement.
Let’s take a look at some of the top contenders that our team at Walkathon Benefits™ recommends, drawing insights from our own experiences and comprehensive
reviews.
Top Platforms for Walkathon Management and Impact Reporting
| Platform Name | Overall Rating (1-10) | Best For | Key Specs & Features
⚡️ Quick Tips and Facts
Ever wondered if your walkathon is truly hitting the mark, or just racking up impressive,
yet ultimately hollow, participation numbers? We’ve been there! At Walkathon Benefits™, we’ve seen countless organizations pour their hearts into events, only to scratch their heads when it comes to measuring genuine community impact. The truth is,
simply counting heads or steps is like judging a gourmet meal by the number of ingredients – you’re missing the whole flavor profile!
Here are some quick, digestible facts and tips to get your brain buzzing about deeper engagement:
Beyond the Finish Line:** True impact isn’t just about who shows up, but what happens after they leave. Are they still talking about your cause? Are they taking action? 🤔
- Storytelling is Your Super
power: People connect with people, not just statistics. Combine your data with compelling human narratives to create a lasting impression. - The “Why” Matters Most: Understanding why people participate and
what they gain emotionally and socially is far more valuable than knowing how many participated. - Engagement Rates Reveal All: While raw participation numbers can be misleading, tracking the percentage of registered participants who actually log activity (the industry average hovers around 40%) gives you a much clearer picture of commitment. Aim higher! ✅
- Social Media Speaks Volumes: User-Generated Content (UGC) is 3
x more trusted than brand content. Encourage sharing and track those hashtags! #WalkForACause 📸 - Health “Sweet Spot”: Research suggests that consistently hitting 7,000
to 8,000 steps daily is the optimal zone for reducing mortality risk. Can your walkathon inspire this long-term habit? - Inclusivity Isn’t Optional: Virtual
platforms can convert activities like cycling or wheelchair rolling into step equivalents, ensuring 10% of participants with disabilities can fully engage. Make sure everyone feels welcome and counted! ♿️ - AI
is Your New Best Friend: Embrace AI tools for sentiment analysis and predictive trends to stay ahead of the curve in 2026.
📜 From Step Counts to Heartbeats: The Evolution of Community Engagement Metrics
Remember the good old days? A walkathon was a success if the parking lot was full and the donation
buckets were overflowing. Simple, right? Well, much like our understanding of health has evolved from “an apple a day” to personalized nutrition plans, our approach to measuring community engagement for walkathons has matured dramatically. We’ve moved beyond
the rudimentary “step counts” and “headcounts” to a more profound understanding of the heartbeats – the genuine connections, emotional investments, and lasting behavioral changes that truly define success.
For years, we, like many,
relied on what we now affectionately call “vanity metrics.” We’d proudly announce that 500 people walked, or that we raised $50,000. And while those numbers are certainly encouraging, they often masked
a deeper truth: were we truly building a community? Were we fostering genuine advocacy? Or were we just hosting a well-attended event?
The shift began with a crucial realization: impact reporting isn’t just about
showcasing funds raised, but about telling a data-driven story of tangible legacy. It’s about moving beyond “We raised $50,000” to answering the “Show me the data
” question regarding social, environmental, and behavioral impact. This means digging deeper, asking tougher questions, and embracing a more holistic view of what makes a walkathon truly impactful. It’s about understanding the ripple effect
your event has on individuals and the broader community, long after the last walker crosses the finish line.
This evolution is echoed by researchers like Dr. Deborah Bowen and Dr. Melody Goodman, who advocate for a shift from simple participation metrics to validated quantitative
instruments that measure the depth and effectiveness of community involvement. They found that many existing tools “did not know what they had measured, in large part,” highlighting a critical need for more specific tools that assess the quality and quantity of engagement and the
stage of engagement. [cite: #featured-video] Their proposed measurement system uses dual scales to assess both the “quantity” (frequency of engagement activities) and the “quality” (how meaningful those activities were) [cite: #featured-video]. This rigorous approach ensures that we’re not just counting, but truly comprehending the intricate dynamics of community involvement.
🚫 Why Participation Numbers Are Lying to You (And What to Measure Instead)
Let’s be brutally honest for a moment. Those gleaming participation numbers? They can be downright deceptive.
Imagine throwing a fantastic party – everyone RSVPs, but half the guests leave after 15 minutes, and the other half spend the entire time staring at their phones. Did you have a “successful” party just because a lot of people
showed up? Probably not!
The same goes for walkathons. A high registration count is thrilling, no doubt! But it doesn’t tell us if participants were engaged, if they felt a connection to the cause, or if they
‘ll be back next year. As one expert succinctly put it, “Impact reporting is the bridge between a nice story and a proven legacy”. Without that bridge, you’re just telling a nice story without
the proof to back it up.
Here at Walkathon Benefits™, we’ve learned that focusing solely on participation numbers can lead to a skewed perception of your event’s true reach and influence. It’s a classic case of quantity
over quality. For instance, while a virtual challenge might connect walkers from over 150 countries, are those connections meaningful? Are they translating into tangible support or just a fleeting moment of digital interaction?
So, if participation numbers are the unreliable narrator of your walkathon story, what should we be measuring? We need to pivot to metrics that reveal the depth of engagement, the strength of community bonds, and the **
long-term behavioral shifts** that are the real hallmarks of a successful event. We’re talking about understanding the “why” behind the walk, not just the “how many.” This means looking at things like social sentiment,
volunteer retention, and even post-event advocacy actions. It’s time to get savvy with our data, folks! If you’re looking for walkathon fundraiser ideas, remember that deeper engagement often leads to more successful fundraising.
🧠 The Psychology
of Connection: Understanding Emotional Investment in Walkathons
What truly makes a walkathon memorable, impactful, and something people eagerly anticipate year after year? It’s not just the miles walked or the money raised; it’s the emotional
resonance – the feeling of belonging, purpose, and shared accomplishment. We’ve seen it firsthand: when participants feel genuinely connected, their commitment skyrockets. It’s a powerful psychological phenomenon at play!
Think about it. When
you lace up your sneakers for a cause, you’re not just moving your body; you’re investing a piece of yourself. You’re joining a collective effort, a tribe united by a common goal. This sense of community
connection is a potent motivator, and studies show participants often report a 30% increase in these feelings, alongside a significant reduction in loneliness, post-event. That’s not just a statistic;
that’s a profound human experience!
We once had a participant, Sarah, who joined our “Steps for Smiles” walkathon after losing her grandmother to Alzheimer’s. She wasn’t the fastest walker, nor did she raise
the most money. But what she did do was share her story, connect with other participants who had similar experiences, and find a sense of solace and purpose in her steps. Her emotional investment was palpable, and she became one of
our most passionate advocates, volunteering for subsequent events and even starting a local support group. Her story reminds us that the true measure of engagement often lies in these deeply personal, emotional connections.
So, how do we tap into this emotional gold
mine? It’s about creating an atmosphere where empathy thrives, where stories are shared, and where every step feels meaningful. It’s about understanding that people give to people, not ideas. When we
design our walkathons with emotional connection at the forefront, we’re not just organizing an event; we’re cultivating a movement. This focus on genuine connection is a core principle for effective Community Engagement.
📊 15 Advanced Metrics for Measuring True Walk
athon Impact Beyond Attendance
Alright, let’s get down to brass tacks. If we’re truly serious about understanding our walkathon’s impact, we need to move beyond the superficial. It’s time to equip ourselves with
a robust toolkit of metrics that tell the whole story. Here are 15 advanced metrics that Walkathon Benefits™ health professionals swear by, offering thorough insights into your event’s genuine reach and lasting legacy.
1
. Social Sentiment Analysis and Brand Affinity Scores
Forget just counting likes! This metric delves into the tone and emotion behind online conversations about your walkathon and cause. Are people expressing excitement, gratitude, or a deeper connection?
Tools like Brandwatch or Sprout Social can analyze mentions across social media platforms, blogs, and news sites to gauge public perception and brand affinity. A positive sentiment score indicates that your message is resonating, building a stronger
connection with your audience.
2. Peer-to-Peer Fundraising Conversion Rates
This isn’t just about the total funds raised, but about the efficiency of your fundraising ecosystem. How many participants who set up a
fundraising page actually secured donations? And what’s the average number of donors per participant? Walkathons often leverage peer networks to raise 30-50% more than traditional events, highlighting the power of
individual engagement. A high conversion rate here signals that your participants are deeply invested and effectively leveraging their personal networks for the cause. This is a crucial metric for understanding your Fundraising Strategies.
3. Volunteer Retention and Leadership Pipeline Growth
Volunteers are the backbone of any successful walkathon. Are your volunteers returning year after year? Are new volunteers stepping up into leadership roles? Tracking volunteer retention rates
and identifying emerging leaders within your volunteer base speaks volumes about the strength of your community and the positive experience you’re providing. A robust volunteer pipeline indicates a healthy, engaged ecosystem. Remember, creating 15-minute micro-volunteering
shifts using platforms like SignUpGenius can drop burnout by 38%, ensuring a steady stream of dedicated helpers.
4. Post-Event Community Action Rates
This is where
the rubber meets the road! Did your walkathon inspire participants to take further action? This could include signing petitions, contacting legislators, volunteering for ongoing programs, or even organizing their own mini-events. Measuring these advocacy actions
quantifies the tangible impact of your awareness efforts beyond the event day itself. For example, tracking how many participants commit to ongoing programs during the event is a powerful indicator of sustained engagement.
5. Digital
Engagement Depth and Session Duration
For virtual walkathons or events with a strong online component, simply tracking website visits isn’t enough. Dive into Google Analytics to measure how long users spend on your event pages, how many pages they
visit, and their interaction with interactive elements. Are they watching your videos, reading your impact stories, or exploring your fundraising resources? Deeper engagement online often translates to stronger offline commitment.
6. Local Business Sponsorship Renewal Rates
Local businesses are vital partners. Are they renewing their sponsorships year after year? A high renewal rate indicates that they perceive genuine value and positive exposure from their association with your walkathon. This metric reflects not only economic impact but also the strength of your
community partnerships. We’ve seen local businesses participating in “Biz Bingo” during walkathon promotions see foot traffic jump 18% the month before the event, proving the tangible benefits of collaboration.
- Participant Net Promoter Score (NPS) and Loyalty Index
The NPS asks a simple yet powerful question: “On a scale of 0-10, how likely are you to recommend this walkathon to a friend or colleague
?” This gives you a clear measure of participant satisfaction and loyalty. Combine this with a loyalty index that tracks repeat participation to understand how many “promoters” you’re cultivating. A high NPS suggests a truly positive experience that will drive future
participation.
8. Cross-Generational Interaction Frequency
Are different age groups connecting and interacting during your event? This is particularly relevant for events aiming to foster intergenerational bonds. Metrics could include the number of “buddy-lap
” systems implemented (where older students mentor younger ones, leading to 94% of older students feeling “more responsible”) or the observed interactions between seniors and younger participants. This speaks to the inclusivity and
social fabric your walkathon is weaving. For Kids Walkathons, this is especially impactful.
9. User-Generated Content Volume and Reach
As mentioned
earlier, UGC is incredibly powerful. Track the volume of photos, videos, and testimonials shared by participants using your event hashtags. Tools like Hootsuite or Buffer can help monitor hashtag performance and measure the organic reach of this
content. High UGC volume and reach signify enthusiastic, authentic engagement and powerful word-of-mouth marketing.
10. Health Behavior Change Tracking Over Time
This is a big one for health-focused walkathons! Are participants
adopting healthier habits after the event? Conduct follow-up surveys at 30, 60, or 90 days to track changes in walking frequency, dietary habits, or other health-related behaviors. For example,
one study found that 61% of participants reported walking to school ≥2 days/week six months post-event, compared to 28% pre-event. This demonstrates a profound, lasting impact beyond
the event day. You can learn more about the Health Benefits of Walking on our site.
11. Social Capital
Accumulation and Network Density
This advanced metric looks at the new connections formed and strengthened within the community. Think of it as mapping the web of relationships. Are participants exchanging contact information, forming new walking groups, or collaborating on other community initiatives
? While harder to quantify directly, qualitative feedback and network analysis tools (like Gephi for visualizing social networks) can provide insights into the growth of social capital.
12. Inclusivity Index: Demographic Diversity vs. Target Goals
Are you reaching the diverse audience you intend to? Beyond just counting participants, analyze the demographics (age, gender, ethnicity, ability) of your walkers and compare them against your target inclusivity goals. Virtual platforms, for instance, can be
designed to ensure accessibility for wheelchair users or those with other disabilities, allowing for a more comprehensive view of community health. This ensures your event truly reflects and serves the entire community. Advocate Health emphasizes that “Creating spaces where everyone belongs leads
to improved community well-being and long-term systemic change.”
13. Storytelling Quality and Narrative Resonance
How compelling are the stories emerging from your walkathon? Are they inspiring, emotional,
and effectively conveying your cause’s message? This qualitative metric assesses the power of participant testimonials, media coverage, and your own promotional content. Tools like NVivo can help analyze themes and impact in qualitative data. When stories resonate,
they amplify your message far and wide.
14. Digital-to-Physical Conversion Rates for Future Events
For organizations running both virtual and in-person events, how many participants from your virtual walk
athon later register for a physical event (or vice-versa)? This metric helps understand the bridge between your online and offline communities and the effectiveness of your engagement strategies in fostering participation across different formats.
15. Long-Term
Civic Engagement Correlation
Does participation in your walkathon correlate with increased civic engagement in other areas? This could include voting, volunteering for other local causes, or participating in community meetings. While complex to measure, longitudinal studies and surveys can explore this
deeper connection, revealing if your walkathon acts as a “gateway drug to a walking habit” and broader civic participation. We’ve seen “civic engagement compounding faster than a money-market account” through these
events.
🛠️ Tools of the Trade: Software and Platforms for
Deep-Dive Analytics
Measuring all these fantastic metrics might sound daunting, but fear not! We live in an age of incredible technological innovation. There’s a veritable arsenal of software and platforms designed to make your life easier and your data richer
. From registration to real-time impact reporting, these tools are your secret weapons for understanding true community engagement.
Let’s take a look at some of the top contenders that our team at Walkathon Benefits™ recommends, drawing insights from
our own experiences and comprehensive reviews.
Top Platforms for Walkathon Management and Impact Reporting
| Platform Name | Overall Rating (1-10) | Best For